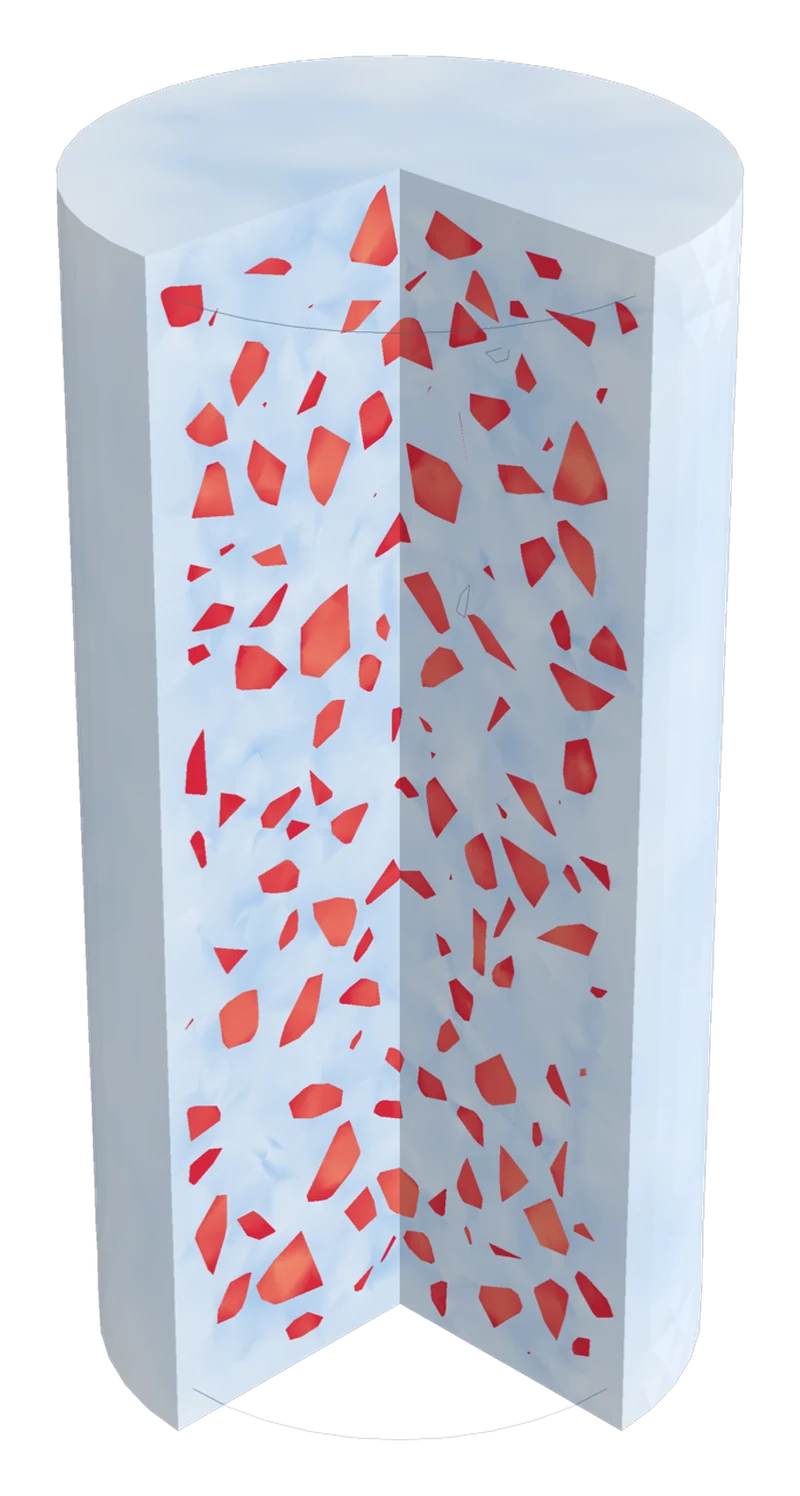
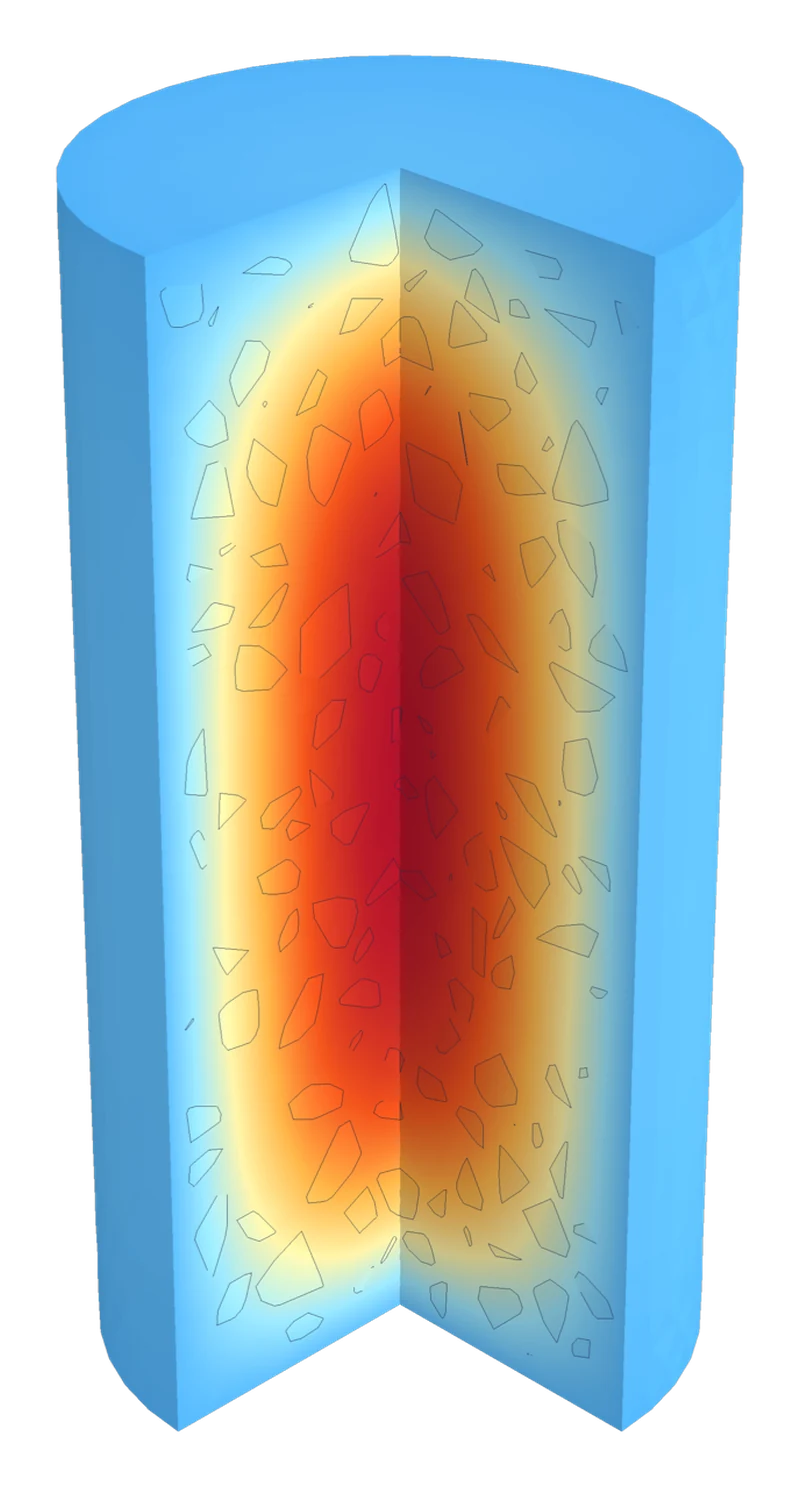
Temperature on the cut faces of the cylinder during cooling: a hot core with every stone outlined Cut-away cylinder coloured by stress under compression: the stones carry more than the paste around them The cylinder after a compression test to failure, with damage bands crossing its middle
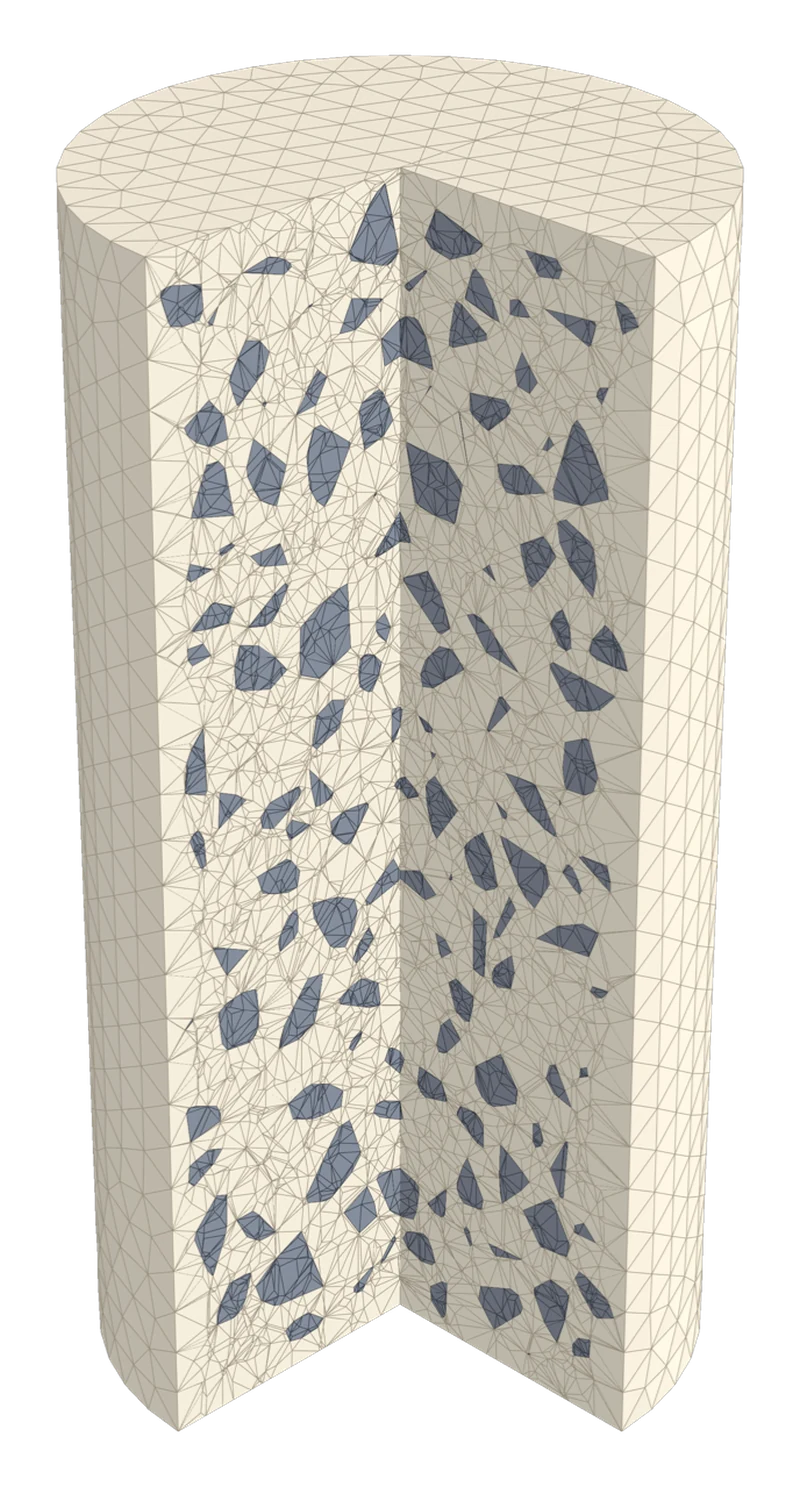
A 6 by 12 inch concrete cylinder drawn see-through, packed with nearly a thousand crushed stones
BETA

Mesoscale Virtual Lab

Virtual testing of concrete at the mesoscale. Cylinder, cube and prism specimens are generated from the mix design with explicit aggregate particles and subjected to thermal, mechanical and fracture tests. The material properties are obtained from the simulated response rather than from tabulated values.

Aggregate Packing

Crushed, angular stones are generated within the specified elongation and flatness limits and placed by random sequential packing to the gradation of the mix, here inside a 6 × 12 in cylinder.

Sand, Water and Air

Fine aggregate, water and entrained air complete the mixture around the coarse aggregate, at the proportions of the mix design.

Conforming Finite Element Mesh

The specimen is discretized into tetrahedra whose faces lie on the surface of each stone, so every stone–paste interface is represented explicitly.

Transient Thermal Response

The temperature field follows the conductivity of each phase. The cooling rate of the core gives the effective diffusivity and conductivity of the mix.

Stress Distribution

Under compression, the stiffer aggregate carries a larger share of the load than the surrounding paste, which governs the composite elastic modulus and the onset of cracking.

Fracture

Loaded to failure between steel platens with a continuum damage model, the specimen develops the cone-and-shear failure of a standard compression test; the peak load gives the compressive strength.
Scroll

Concrete at the scale of its stones

At the scale of a footing or a pier, concrete looks like one uniform material, and that is how a structural model treats it. Up close it is anything but: crushed stone, sand grains and air voids held together by cement paste, each with its own stiffness, strength, conductivity and thermal expansion.

The mesoscale is the scale in between, millimetres to centimetres, where you can see the individual stones. A mesoscale model builds the specimen out of those ingredients, so the behaviour of the concrete is computed from them: how heat detours through the stones, how load concentrates where two stones nearly touch, where the first crack opens.

  • The properties of your mix before a single cylinder is cast.
  • "What if" questions a laboratory cannot answer quickly: a different stone, a different size, more paste.
  • Results that feed straight into the thermal stress analysis of your member.
Cut-away cylinder coloured by stress under load: the stones carry more than the paste around them

Real stone shapes, and a mesh that follows them

A mesoscale result is only as good as the specimen it is computed on. Two things make or break it: the shape of the stones, and the finite element mesh that carries them into the analysis.

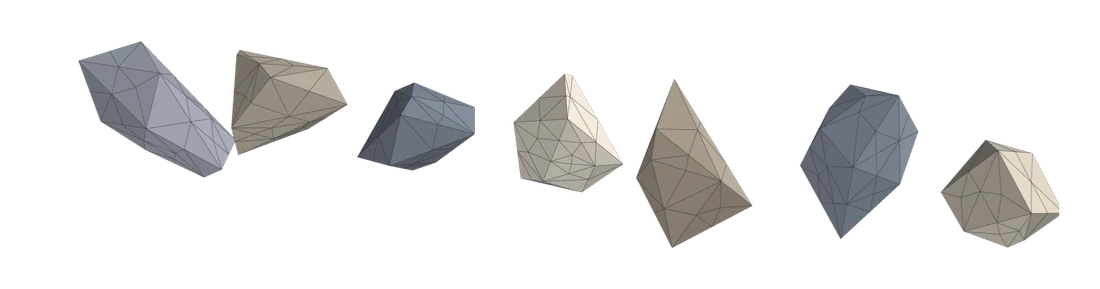
Seven crushed stones from the virtual specimen, angular and elongated, each covered by its surface mesh

Crushed stones, not marbles

Real coarse aggregate is crushed rock: angular, with flat faces, sharp edges and corners, longer one way than the other. The lab builds every stone that way: a random angular body, stretched and flattened within the length-to-width and thickness-to-width limits you set, rotated at random. It sizes them to the AASHTO size number of your aggregate. Spheres are there too, for comparison.

  • Corners and edges are where stress concentrates and where the first cracks start.
  • Flat, elongated stones line up, block heat and deflect cracks differently from round ones.
  • The mortar gap between stones is controlled, as in a real well-consolidated mix.
The cut-away cylinder showing its finite element mesh: small tetrahedra following the outline of every stone on the cut faces

A mesh that follows every stone

The specimen is cut into tetrahedra whose faces lie exactly on the surface of each stone, so every interface between stone and paste is in the model. That is where heat changes speed, where stress jumps and where concrete usually cracks first. The paste between two close stones gets elements small enough to resolve it.

  • Mesh presets from fast to fine, or your own element size, with 1st- or 2nd-order elements.
  • A mesh convergence study runs the same specimen on finer and finer meshes to show the result has settled.
  • The fracture model is scaled by element size, so crack energy does not change with the mesh.

Four steps, like the real laboratory

Each step shows its result in 3D before you move on, so you can see exactly what is being tested.

  1. Cast the specimen

    Enter the batch weights of the mix and pick the specimen: a 4×8 or 6×12 in cylinder, a 100 or 150 mm cube, a beam prism, or any size you set. Crushed stones of the AASHTO size number you pick are packed one by one at random until their share of the mix is reached; sand grains and air voids can be bodies too. A new random seed is a new cylinder from the same batch.

  2. Mesh it

    Every stone, grain and the paste between them is cut into small tetrahedra that follow their shapes. This is the finite element model the tests run on.

  3. Run the test

    Pick a test and press Run. The live log and the charts follow it as it goes; the 3D views show the temperature, stress or cracks at any moment, on the outside and on a cut face.

  4. Use the result

    A report table to copy into a spreadsheet, a parameter file or, when the lab is opened from the analyzer, one click to send the result to its Material tab.

Heat, stress and cracks you can see

Real results from one virtual cylinder: 986 crushed stones, 171,000 elements, a quarter cut away to show the inside.

What each test does, and what you get

All four run on the same specimen, so you can cool it, expand it, load it and break it without building it again. Each test shows only the inputs it uses, with a note under every group.

Cooling test → conductivity and diffusivity

The virtual version of a transient thermal conductivity test. The specimen starts hot and uniform and is cooled by running water at a set temperature and film coefficient. Two virtual thermometers, one at the centre and one near the side, record how it cools; the decay of the centre temperature gives the thermal diffusivity, and with the density and specific heat of the mix, the conductivity.

Each body (stone, sand grain, air void) conducts heat at its own rate, so the result reflects how much stone there is, of what kind, and how it is arranged. An instant estimate by a mixing rule updates as you type, for comparison.

Conductivity kDiffusivityDensity & specific heatCooling curves
Temperature on the cut faces of the cylinder during cooling, with every stone outlined

Expansion test → coefficient of thermal expansion

Like a length-change test in an environmental chamber: the specimen is brought to a series of uniform temperatures, free to expand. The stones expand less than the paste and, being bonded to it, hold it back. How much depends on the stiffness and expansion of each ingredient. The slope of strain against temperature is the CTE of the concrete, axial, lateral and volumetric.

The picture is the 6×12 in cylinder heated by 30 °C, its expansion magnified 250 times past its original outline (thin line). The paste wants to grow more than the stone, so it pulls the stones into tension (red, about 1,000 psi) and is itself squeezed (blue). The concrete's CTE came out at 5.3 ×10−6/°F (9.5 ×10−6/°C), between the stone and the paste.

CTE (axial, lateral, volumetric)Strain–temperature chart
The cylinder heated by 30 degrees C, expansion magnified 250 times: stones in tension shown red, the paste around them slightly compressed

Stiffness & strength test → E, ν, f′c and ft against age

At each age you choose (1, 3, 7, 14 and 28 days by default), the hydration model of the Elastic Modulus tool works out the cement paste from the cement chemistry, the slag or fly ash and the curing temperature. That paste is placed between the stones and the specimen is compressed: the end force and the sideways bulging give the elastic modulus and Poisson's ratio of the concrete.

Then, at every age, the specimen is pulled apart and crushed to failure with cracking, as in the fracture test: the peaks of the two stress–strain curves are the tensile and compressive strength at that age. The modulus is fitted against the degree of hydration and as E = a·f′cb, ready for the analyzer. A quick option without cracking is there for fast checks.

E against age & hydrationPoisson's ratiof′c and ft curvesE = a·f′cb

Fracture test → the full stress–strain curve and the crack pattern

A strength test carried past the peak, as in a closed-loop testing machine: the specimen is shortened (compression) or pulled (direct tension) in small steps between frictionless platens. Every element of the paste keeps its stiffness until it reaches its cracking strain, then loses it as the crack opens. Cracks never close up, so the damage you see at a step is the damage done so far.

You choose how the paste cracks: Griffith–Rankine (tension cracking and Griffith micro-cracking in compression, with separate cracking and crushing energies), Mazars, modified von Mises or Rankine. The weaker zone around each stone, the fracture energies and whether the stones can crack too are all inputs.

Stress–strain curvef′c or ftStrain at peakCrack pattern at every step
A 150 mm cube at four stages of the compression test: damage gathers in a band through the middle while the top and bottom held by the platens stay intact Stress-strain curve of the virtual compression test, rising to its peak and falling as the cracks open

A 150 mm cube of the same mix at four stages of the test (blue intact, red cracked): the platens keep the top and bottom whole while the damage gathers into a band through the middle: the hourglass failure of a cube test. Peak 7,950 psi (54.8 MPa), higher than the cylinder, as cube tests are.

Built on the same research as the rest of the site

The lab does not invent its material properties. The cement paste at any age comes from the hydration and micromechanics models of the Material Modeling tools, run exactly as they are on their own pages; the strength of the paste comes from the Compressive Strength model. The lab adds what those models cannot see: the stones, where they are, and what they do to the heat, stress and cracks around them.

  • Paste hydration and stiffness from the cement oxides, slag, fly ash and curing temperature.
  • Fine ingredients that are not modelled as bodies are blended into the paste by homogenization.
  • Crack-band damage models, scaled by element size so the energy to open a crack does not depend on the mesh.
  • Every input explained where you enter it.
Stones in a 6×12 cylinder~1,000
Finite elements~170k
Cooling test~3 min
Fracture test~35 min

Times on the analyzer's computer for the stones-only specimen shown here. Sand grains and air voids as bodies make the model more detailed and the tests much longer.

BETA

Cast your first virtual cylinder

The lab runs on the same machine as the thermal stress analyzer, so it uses the analyzer beta. Open it from the analyzer's Material tab to send its results straight back.